Dashboard Import Export
Download PDFExport, edit, and re-import LogZilla dashboards in YAML or JSON format using the UI or the logzilla dashboards CLI for sharing between instances
Dashboard Import and Export
LogZilla supports importing and exporting dashboards so that
configurations can be shared across teams or moved between LogZilla
instances. The same capability is available through the user
interface and the logzilla command line.
Dashboard Format in LogZilla
A LogZilla dashboard is stored in either YAML or JSON format. Both formats support the same schema. The following YAML snippet shows the basic structure of a dashboard:
yaml- config:
style_class: infographic
time_range:
preset: last_1_hours
title: Meraki DHCP
is_public: true
widgets:
- config:
col: 0
filter:
- field: program
value: Meraki DHCP
row: 0
show_avg: true
show_last: false
show_max: true
show_min: false
sizeX: 6
time_range:
preset: last_1_minutes
title: Meraki DHCP Events Per Second
type: EventRate
The top-level keys are config, is_public, and widgets. Each
widget has its own config key describing the widget type and the
filter applied. Layout values include column and row placement
(col and row), display size (sizeX), and time_range.
Manipulating Dashboards in LogZilla
Dashboards can be manipulated in two ways: through the UI menu on an
open dashboard, or through the logzilla dashboards CLI subcommand.
Dashboard Manipulation via UI
The dashboard action menu is shown below:
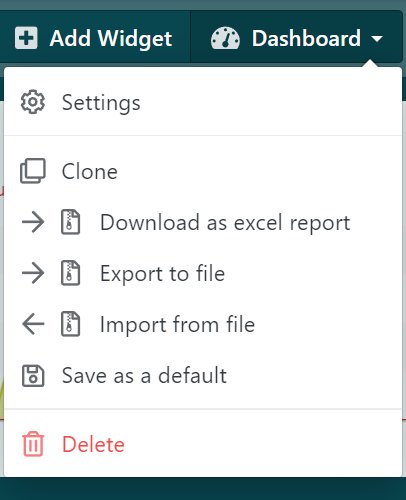
- Clone: Create a copy of an existing dashboard.
- Download as Excel report: Download the dashboard as an Excel report.
- Export to file: Write the dashboard configuration to a file and download it to the local system.
- Import from file: Upload a dashboard configuration file and load it into LogZilla.
- Save as a default: Designate the dashboard as the default assigned to new users.
- Delete: Permanently remove the dashboard from the system.
Dashboard Manipulation via Command Line
The logzilla dashboards subcommand provides equivalent capabilities.
Import
To import a dashboard from a YAML or JSON file:
bashlogzilla dashboards import -I mydashboards.yaml
If the dashboard file contains a typo or a field LogZilla does not recognize, the import fails with an error that names the bad field. The dashboard is not partially imported. Fix the field in the file and run the import again.
Export
To export all dashboards to a YAML file:
bashlogzilla dashboards export -O mydashboards.yaml
The -I flag specifies the input file for the import command; the
-O flag specifies the output file for the export command.
To use YAML instead of JSON, add the -F yaml option to the above
commands.
A single dashboard can be exported by first listing available dashboards:
bashlogzilla dashboards list
which shows the list of dashboards with names and dashboard IDs. The specific dashboard can then be exported as follows:
bashlogzilla dashboards export --dashboard-id <dashboard_id> -O mydashboard.yaml
Using Dashboards from Apps in LogZilla
Dashboards are included with LogZilla apps. Once an app is installed, the app's dashboards support the full set of actions including cloning, editing, importing, and deleting. Operators modifying an app-supplied dashboard for a specific environment can use the export, edit, and re-import flow described below.
Example: Exporting, Changing, and Importing a Dashboard
The following example walks through exporting, modifying, and re-importing a dashboard.
Scenario: Modifying the Linux DNSmasq App Dashboard
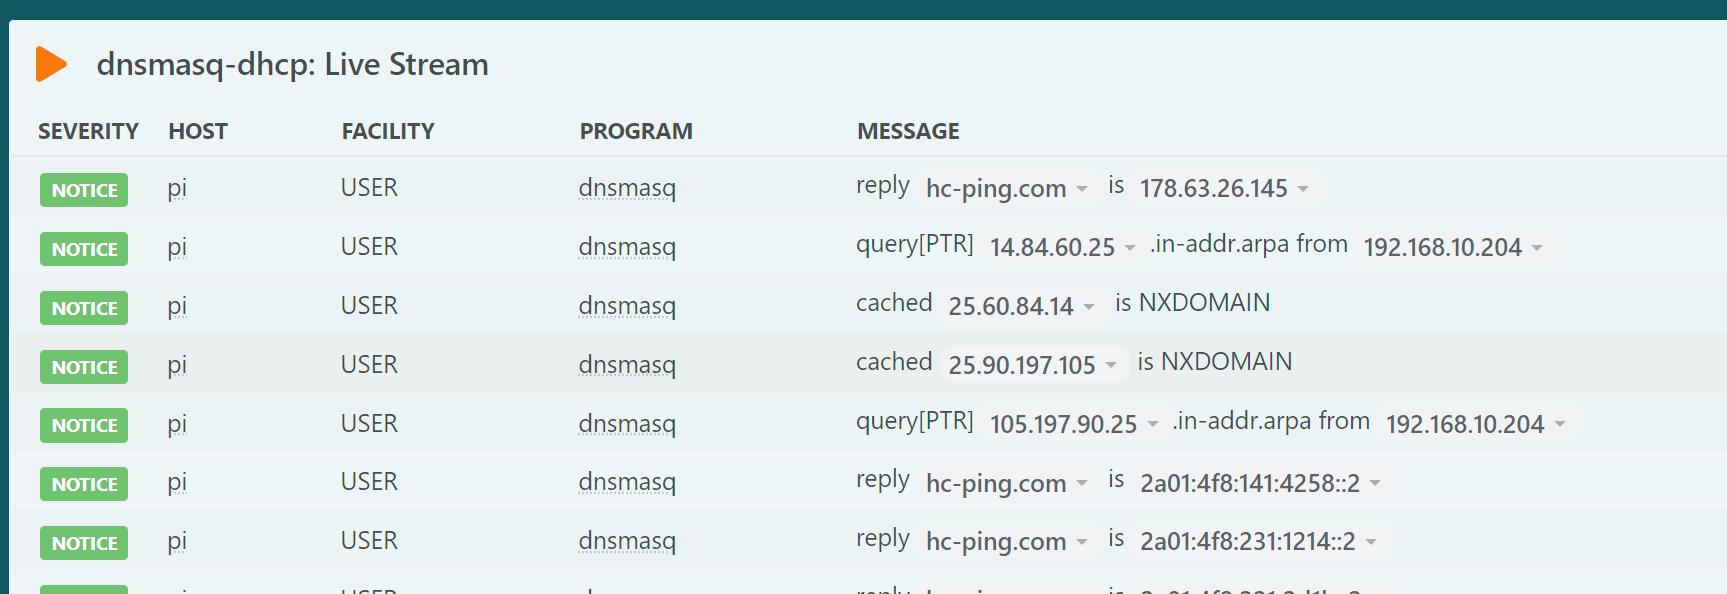
The Linux DNSmasq app includes a dashboard named "Linux: dnsmasq Events" containing a widget called "dnsmasq-dhcp: Live Stream", which presents a continuous stream of incoming DHCP log messages. By default this widget displays events of type "query", "cached", and "reply":
In this example the "cached" events are filtered out of the widget. The procedure is:
- Export the dashboard
- Edit the configuration file
- Re-import the modified dashboard
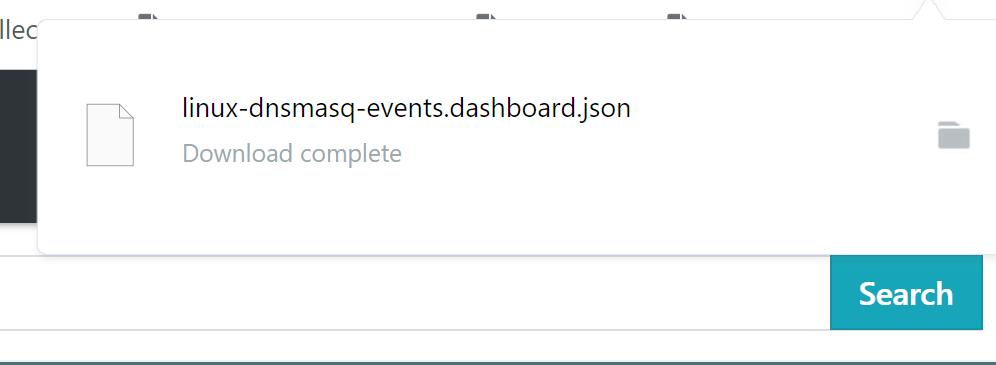
Step 1: Exporting the Dashboard
Click Export to file on the dashboard menu described earlier. The dashboard configuration file is downloaded to the local system:
Step 2: Editing the Configuration File
The downloaded file contains JSON on a single line. A JSON formatter makes the file easier to edit. The formatted file begins:
json{
"config": {
"style_class": "infographic",
"time_range": {
"preset": "last_1_minutes"
},
"title": "Linux: dnsmasq Events"
},
"widgets": [
{
followed by widget configuration elements. The live-stream widget configuration looks like this:
json {
"config": {
"col": 0,
"columns": [
"severity",
"host",
"facility",
"program",
"message",
"first_occurrence",
"last_occurrence",
"counter"
],
"filter": [
{
"field": "program",
"op": "eq",
"value": [
"dnsmasq*"
]
}
],
"limit": 16,
"row": 1,
"sizeX": 6,
"sizeY": 2,
"sort": "-first_occurrence",
"title": "dnsmasq-dhcp: Live Stream"
},
"type": "Search"
}
To exclude messages matching *cached*, add a second filter entry:
json "filter": [
{
"field": "program",
"op": "eq",
"value": [
"dnsmasq*"
]
},
{
"field": "message",
"op": "ne",
"value": [
"*cached*"
]
}
],
Step 3: Importing the Modified Dashboard
Remove the existing dashboard before importing the modified copy:
bashlogzilla dashboards remove "Linux: dnsmasq Events"
textThese dashboards will be removed: id: 270, title: Linux: dnsmasq Events, public: False, widgets: 4 Do you want to remove all selected dashboards [Y/n]
After confirming removal, import the modified file:
bashlogzilla dashboards import -I linux-dnsmasq-events.dashboard.json
The absence of output indicates a successful import. Refreshing the LogZilla UI shows the updated dashboard:
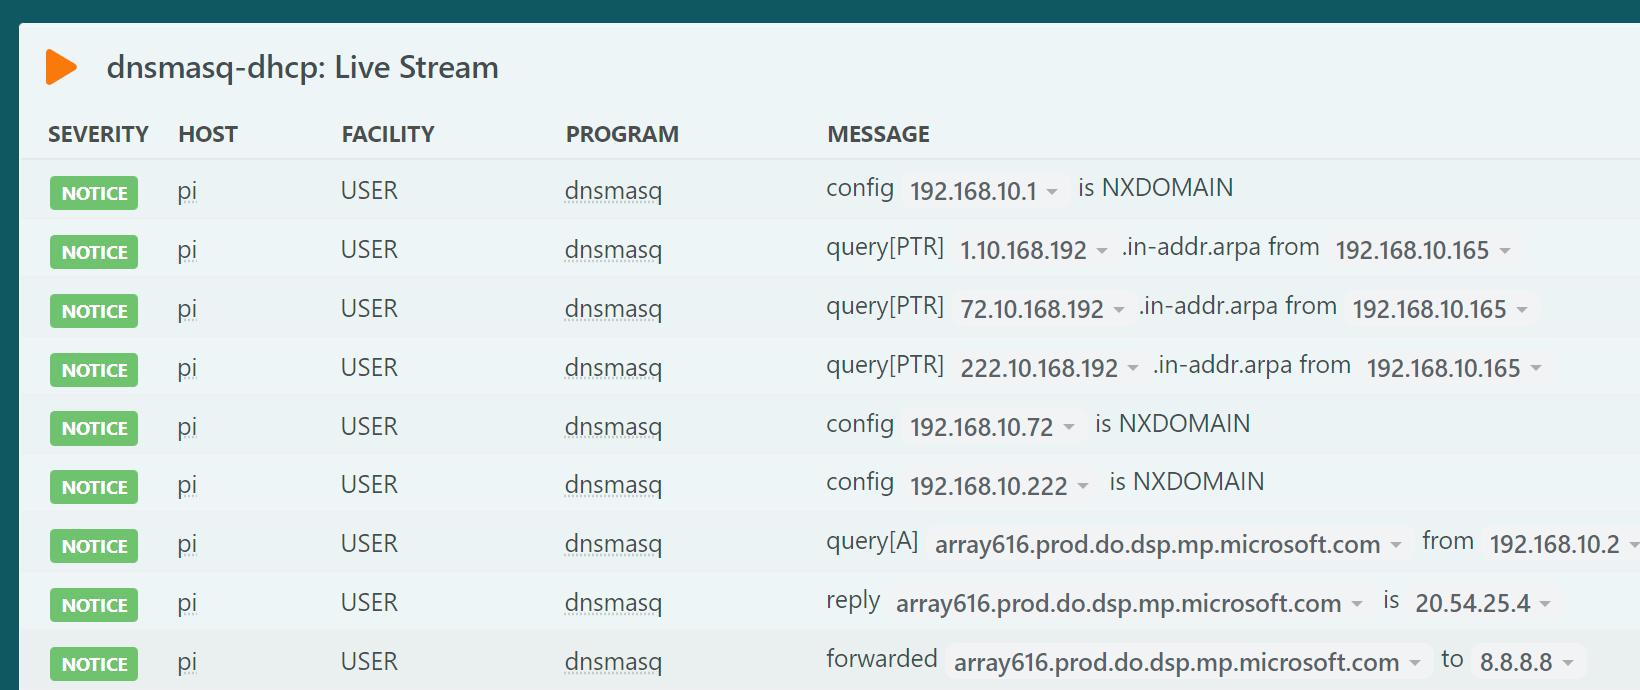
The widget now displays only the desired event types.