A joint whitepaper from LogZilla and AlvaLinks.
Download: Get the PDF version of this whitepaper →
Executive Summary
Most AI in network operations runs on telemetry that never sees about a third of the network, and that missing third is where incidents tend to start. Bigger models do not close that gap; they only produce more confident answers from the same incomplete picture. AlvaLinks' ObservaNet sensors measure the blind segments directly, and LogZilla's AI turns the result, alongside every other event source, into root cause and prioritized action. The rest of this paper explains why the gap exists, why it defeats most AI-for-NetOps products, and what changes once it closes.
The conversation about AI in network operations has skipped a step. Vendors are racing to put large language models in front of dashboards and call the result "autonomous," but the dashboards have not changed, and neither has the telemetry feeding them. The gaps in that telemetry are precisely where incidents originate: the segments, paths, and third-party links that no SNMP poll ever reaches.
In a recent Network World opinion piece, network reliability engineer Jay Dave put numbers on the problem. Citing Broadcom's 2026 State of Network Operations report, he notes that 95% of IT professionals lack visibility into network segments, especially in public cloud. By his own framing, roughly 30% of the relevant paths during an incident are uninstrumented. In his words, "anything traversing a third-party network is invisible."
Dave's article goes on to argue that current AI in NetOps stalls on causation, cross-tool reasoning, and the underlying visibility floor. That assessment is fair for most products in the category, though not for all of them. LogZilla's AI was built on 15 years of context engineering. By the time it sees a question, the events it reasons over have already been parsed into a consistent shape, mapped to MITRE ATT&CK techniques, attributed to compliance frameworks, and resolved against the actual vendors and devices in the environment. A multi-step incident question returns a single synthesized answer instead of five tool tabs, and the AI reasons about causation and crosses tools natively because the data it sees is no longer raw.
What no AI can do is reason about data that was never measured. That visibility floor is real, and closing it requires a sensor layer that sees the data path traditional telemetry misses. AlvaLinks' ObservaNet flow-paired sensor platform supplies that layer with millisecond-accurate, in-stream measurement across owned, cloud, and third-party network segments.
The combined architecture closes the gap Dave identified. AlvaLinks ObservaNet supplies high-fidelity telemetry from the parts of the network nothing else can see. LogZilla's AI turns that signal, alongside every other event source, into root cause and prioritized action. Neither replaces the SIEM, the APM tool, or the existing observability investment. Together, they make all of them work.
The 30% Problem
A third of the network path is invisible during the average incident, and that blind third is where trouble begins. Every NOC has the same shape: a wall of dashboards, a team trained to spot trouble in colored graphs, and a tier-1 triage process that begins with "is anyone else seeing this?" and ends, hours later, with a postmortem that traces the incident to a segment no one was watching.
Dave's Network World piece names this for what it is: a structural blind spot in how networks are instrumented.
- SNMP polls in minute increments. By the time a counter trips, the event is history.
- Streaming telemetry is configured on a fraction of interfaces. The operational cost of streaming everything to a TSDB is prohibitive.
- Traceroute cannot penetrate firewalls that block ICMP, handles asymmetric routing poorly, and provides stale path data.
- ECMP fabric paths are often uninstrumented. BGP decisions on remote routers require manual SSH access to discover.
- Third-party networks are invisible by definition. When a stream traverses a cloud transit provider, a CDN, or a last-mile carrier, the operator has no telemetry on the segment until something breaks downstream of it.
This is the 30% Problem: at any given moment during an incident, roughly a third of the relevant data path is dark. Dashboards aggregate the visible two-thirds and assume the rest is fine. AI models trained on that data inherit the same blind spot.
A note on the syslog question. Dave's article notes that syslog arrives with "variable delay." That characterization holds for UDP syslog from 2005. It does not hold for modern deployments, where reliable transport and on-disk buffering are standard. Syslog remains the most universally deployed event-emission protocol in the world. Its weakness is not how it arrives but what happens afterward: most platforms drop it into a flat index, never enrich it, and leave the operator to grep through millions of lines. The failure is in the tooling, not the transport.
The article cites the July 2025 Cloudflare 1.1.1.1 outage as an example of where pattern-matching fails badly. A system trained on prior incidents would have classified the event as a BGP hijack, a familiar shape in its training data. The actual cause was an internal routing configuration error. Models do not reason about novelty unless they have been built to; they match. Matching against an incomplete picture produces confident, wrong answers at machine speed.
The implication is uncomfortable for the current generation of AI-for-NetOps products: adding intelligence to incomplete telemetry compounds the error rather than solving it.
Where Most AI Stalls, and Where LogZilla Does Not
Most AI for NetOps stalls exactly where incidents get hard: causation in novel scenarios, and reasoning across the tools an investigation actually spans. LogZilla is built differently. To see why the distinction matters, start with where the category genuinely earns its keep. Dave's article distinguishes three areas where AI in NetOps holds up under scrutiny:
- Anomaly detection at scale. Statistical baselining against historical and peer behavior processes hundreds of millions of data points per day across tens of thousands of devices.
- Alert correlation. During major incidents, AI collapses hundreds of symptom-based alerts into a handful of meaningful clusters. Dave cites 300 alerts reduced to five clusters.
- Context assembly. Large language models integrate BGP data, looking-glass output, ticket history, and topology into plain-language summaries that compress the initial twenty minutes of investigation into seconds.
Dave is precise about the boundaries. He names two things current AI genuinely cannot do: reason about causation in novel scenarios, and see past the visibility floor. Cross-tool context assembly he treats more charitably, as real but unfinished work where an LLM today compresses the first 30 minutes of an investigation without actually conducting it.
For most products in the category, that assessment is correct. They wrap a generic LLM around a single observability product, hand it raw events, and hope the model can infer infrastructure context it has no exposure to. It cannot, so it hallucinates vendor behavior, misses operational nuance, and produces confident summaries that experienced engineers recognize as wrong. LogZilla is the exception on both fronts: it goes further than compression on cross-tool work, and it is built differently on causation.
What sets it apart is not the model but the 15 years of context engineering underneath it.
The AI Already Knows the Environment
Most AI assistants treat each question like a blank slate, but LogZilla's AI does not. From the first question of the first conversation, it already knows what vendors are present, what fields they emit, what those fields mean, and which devices are most active right now.
The result: ask about FortiGate, and the answer reflects how FortiGate actually behaves. Ask about Cisco mnemonics, and the answer reflects the actual mnemonics in the environment. There is no hallucination of vendor semantics, no generic-LLM gloss, no "based on common configurations" hedge. Vendor-specific questions return vendor-correct answers.
One Question, Not Five Tools
A real incident question is rarely a single query. "Which firewall rule changes preceded the auth failures in EMEA between 14:00 and 14:30, and how did they correlate with the BGP session resets on the adjacent edge routers?" is four investigations stitched together.
Other AI products in this category either refuse the question, return one piece of it, or hallucinate the rest. LogZilla's AI answers the whole thing. The operator asks once, in plain English, and gets a synthesized result that crosses sources, time ranges, and event classes. This is the work senior engineers used to do by hand across five browser tabs. It now happens in seconds.
Nothing to Bounce Between
Dave notes that during an investigation an engineer "bounces between several tools." That assumes those tools are separate products. In LogZilla they are not. Syslog, SNMP traps, HTTP receivers, third-party telemetry, ticket history, and the AlvaLinks ObservaNet data-path stream all live in the same normalized event store. The AI does not bounce, because there is nowhere to bounce to. Every source the operator would have opened in a separate browser tab is already part of the same conversation. What Dave describes as compressing the first 30 minutes of context-gathering, LogZilla eliminates: there is no context to gather across tools, because the context already lives in one place.
MITRE ATT&CK and Compliance Framework Tagging
Every applicable security event is mapped to MITRE ATT&CK techniques and tactics at ingest. Every compliance-relevant event is tagged with the applicable framework. LogZilla ships with 67 compliance frameworks built in, including NIST 800-53, NIST 800-171, NIST CSF, NIST 800-82, FedRAMP, StateRAMP, CMMC, HIPAA, PCI-DSS, SOX, GLBA, FERPA, FFIEC, SOC 1/2/3, GDPR, UK-GDPR, LGPD, PIPEDA, ISO 27001/27002/27017/27018/27701, ISO 22301, and CIS Controls.
When an auditor or analyst asks "show me every privilege escalation that touched HIPAA-tagged systems last quarter," the answer is a query, not a project.
Eleven-Class Event Taxonomy
Events are categorized into eleven cross-vendor classes: Auth, Security, Network, System, Config, HA, Web, Compliance, IoT, OT, VoIP. Aggregate apps (AuthOps, SecOps, ComplianceOps, ITOps, NetOps, WebOps, IoTOps, OTOps) roll up events within each domain into pre-built dashboards, triggers, and AI context. The taxonomy gives the AI a stable vocabulary across hundreds of vendor formats.
The combined effect is that when an operator asks LogZilla's AI for help, the model is not staring at raw log lines. It is reasoning over events that have already been understood, with vendor context resolved, security relevance mapped, compliance attribution in place, and the cross-domain rollups pre-computed. The AI inherits all of it as the starting point of the conversation rather than its destination. The "HOLY ___" reaction from first-time demos is not a marketing line but what happens when 15 years of context engineering meets a modern LLM.
Where Even LogZilla's AI Cannot Compensate
One stall in Dave's list is genuinely architectural and applies even to LogZilla: the visibility floor. If a third-party network segment never produced an event, no amount of AI reasoning will recover it. If a microburst happened between two cloud regions and SNMP never saw it, the AI cannot infer the microburst. The only fix for missing telemetry is more telemetry.
That is the layer AlvaLinks supplies.
The Sensor Layer the 30% Problem Demands
AlvaLinks built ObservaNet to overcome a new category of failures that can stall any application: Gray Failure. Identified and researched in the cloud in 2017 by Microsoft, a gray failure is a path or component that the application experiences as broken, while every health check the system runs reports green. Any operation that runs its business applications in the cloud and/or data centers, depends on network connectivity for business continuity, and relies on connectivity provided by multiple service providers across multiple segments, is at risk.
You have seen this before. It closed as "no fault found." The app that stalled at close. The choppy audio that ruins a customer's experience. The API that timed out. The backup glitch that quietly choked your IoT.
AI already triggers a new family of gray failures, a result of traffic patterns completely different from the ones we have known for the last four decades. As businesses become more dependent on AI, the AI traffic surges change network behavior. Delays become a factor that directly affects operational efficiency.
ObservaNet takes a different approach from the metrics-aggregation model. Traditional tools tell you that "something looks wrong." ObservaNet identifies the type of error, where it occurs, which traffic is affected, and whether the impact is directional, flow-specific, or path-specific.
- Total Outage vs. Gray Failure: detects partial impairment even when aggregate metrics look healthy.
- Congestion vs. Policing: distinguishes capacity saturation from rate-limiting behavior, per flow.
- Forward vs. Reverse Path: identifies whether degradation is directional, because not all impairments are symmetric.
- Flow-Specific vs. Path-Specific: pinpoints whether an issue is path-wide or isolated to a single flow.
The unit of observation is the stream, not the interface. The measurement happens in the data plane, not the management plane. And critically, the agents operate across third-party network boundaries: the segments Dave identifies as invisible to traditional observability.
ObservaNet detects the faintest signal of network trouble in the parts of the network that existing tooling cannot see. It is the sensor layer the 30% Problem demands.
The Combined Architecture
ObservaNet detects the events' signatures. LogZilla turns them, alongside everything else the operator collects, into a single understood stream that an AI can actually reason about.
What the operator sees in practice:
- Event storms stop being event storms. Patented ingest-time deduplication (US Patent 8,775,584) turns a duplex-flap flood of hundreds of thousands of duplicate events into a handful of unique events with accurate occurrence counts. The dashboard stays readable. The downstream SIEM stops billing for noise.
- Every supported vendor arrives pre-understood. 67 built-in applications cover Cisco IOS and IOS-XR, Palo Alto, Fortinet, Check Point, Arista, Juniper, F5, SonicWall, Meraki, Barracuda, BlueCat DNS, Zeek, and dozens more. Each one ships with the parsing, dashboards, alerts, and AI context already built. Day one is not a project.
- Security events are already mapped to MITRE. Compliance-relevant events are already tagged with the applicable framework. Auditors get answers, not exports.
- Cross-device correlation happens automatically. When the same condition appears across multiple devices, or when a pattern of related events emerges over a time window, the alert reflects the pattern rather than the individual symptoms.
- Routine recovery runs itself. Pre-built remediation handles the actions a team would otherwise run by hand on every page. Approval workflows keep humans in the loop for novel actions.
- Scale is a non-issue. 10 TB per day on a single server. 230 TB per day on a Kubernetes cluster. Sub-second query response on billions of events.
Enrich, Don't Replace
LogZilla's forwarding module deduplicates events at ingest and then forwards the compressed, enriched stream to Splunk, Datadog, syslog receivers, SNMP trap collectors, or any other downstream system. The host of origin is preserved via an ORIGIN marker so the downstream tool attributes events correctly. Customers routinely cut Splunk and Datadog ingest costs by 60 to 80 percent this way, paying for one copy of intelligent processing instead of paying their SIEM vendor to process duplicates.
The combined architecture inserts cleanly into existing operations:
- AlvaLinks ObservaNet locks onto data-path problem signatures.
- LogZilla ingests, deduplicates, enriches, correlates, and reasons across the full event stream.
- LogZilla forwards the cleaned, enriched stream to whatever the customer already runs.
There is no rip-and-replace, no retraining, and no politics about which vendor "owns" observability.
What Changes When the Gap Closes
Close the gap, and four things become possible on day one that were not on day zero: anomaly detection you can trust, correlation that crosses the third-party boundary, causation queries that return answers, and automation safe enough to deploy.
Anomaly detection becomes trustworthy. Statistical baselines built on minute-resolution SNMP data flag the wrong things. The same algorithms applied to millisecond-accurate, data-path-resolved telemetry produce alerts an engineer can act on. False positives drop, and the team stops tuning thresholds and starts solving problems.
Correlation extends across the third-party boundary. When a stream degrades, the operator can see whether the cause sits inside the owned network, the upstream provider's network, or the path between them, without filing a ticket and waiting. The 300-to-five-clusters benefit Dave describes assumes the alerts exist in the first place. The combined architecture ensures they do.
Causation queries succeed. "What changed on the path from CDN edge to inference cluster between 14:02 and 14:07, and which firewall rule changes preceded it?" is a question LogZilla's AI answers in seconds. Other AI products return apologies because the underlying data is partial. With ObservaNet feeding the data plane and LogZilla reasoning across the full event picture, the same question returns an answer.
Automation becomes safe enough to deploy. SOAR has lived in approval-gated workflows for years because operators do not trust the diagnosis enough to let it act. With complete telemetry feeding a context-aware AI, the approval gate can move from "every action" to "every novel action." The routine recovery scripts, the ones the team runs the same way every time, run themselves.
The downstream economic effects are the ones a CFO recognizes.
- War-room time falls because the picture assembles itself. The first thirty minutes of every major incident, the part Dave describes as "slow and mostly copy-paste," happens before the call.
- Headcount pressure eases because the on-call rotation is no longer the system of record for tribal knowledge; the AI is.
- Training time falls because new engineers no longer need to learn five tools' query languages to be useful; they only need to know how to ask questions in English.
- Audit prep stops being a project. Compliance frameworks are tagged at ingest. Quarterly evidence collection is a query.
- Downstream tool spend falls because deduplication and forwarding cut SIEM and APM ingest volumes by the share that was always noise.
Reference Architecture
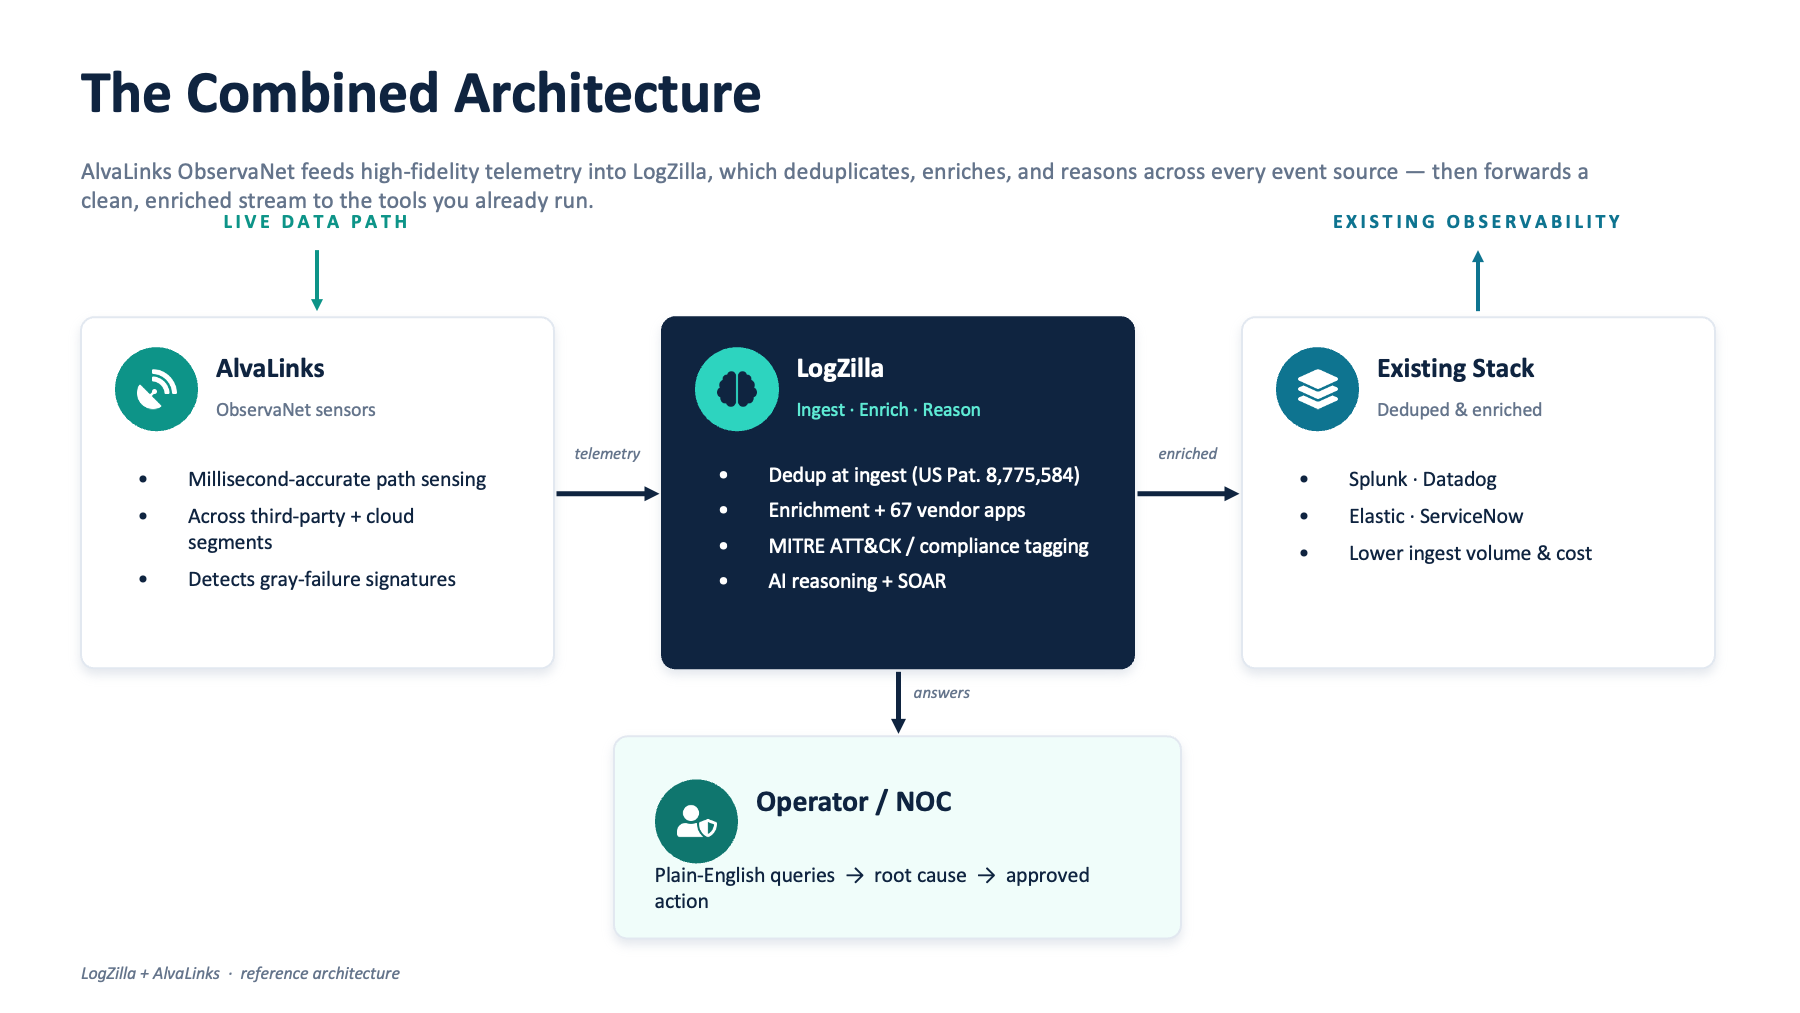
Data flow:
- ObservaNet measures the data path itself, including the third-party and cloud segments that other observability tools never see.
- LogZilla collects that telemetry alongside every other event source the customer already has, and arrives at a single, fully understood event stream.
- The operator asks questions in plain English. The AI answers across the whole environment, including multi-step investigations that would otherwise require five tools and an experienced engineer.
- The cleaned, enriched event stream flows downstream to the existing SIEM, APM, ITSM, and ticketing systems, with host of origin preserved and ingest volumes cut.
Deployment options: On-premises, public cloud, air-gapped, tactical edge. AlvaLinks ObservaNet's agents deploy where the stream is. LogZilla scales from 10 TB/day on a single server to 230 TB/day on a Kubernetes cluster. CMMC and FedRAMP compliant.
Next Steps
Closing the 30% gap is a sensor problem on one side and a context problem on the other. AlvaLinks built the sensors. LogZilla spent 15 years building the context layer that lets AI actually reason about infrastructure. Teams that pair the two will spend less time in war rooms, ship more reliable services, and stop paying downstream observability vendors to process noise.
About the Authors
LogZilla delivers AI-powered operational intelligence for SecOps, NetOps, DevOps, and Compliance. Plain-English questions get accurate, environment-aware answers. Security events arrive already mapped to MITRE ATT&CK. Compliance evidence is tagged at ingest across 67 frameworks. Patented deduplication and downstream forwarding cut SIEM and APM ingest costs without losing fidelity. Deployable in minutes, on-premises, in cloud, or air-gapped. Trusted by global enterprises, federal agencies, and tactical edge deployments. Fifteen years in production. Learn more at logzilla.ai.
AlvaLinks delivers flow-paired data-path sensors for deep, real-time network observability, capable of detecting gray-failure signatures for enterprises and service providers operating mission-critical infrastructure or cloud services. By delivering granular visibility into network behavior across multi-segment, multi-region networks, AlvaLinks enables faster detection, diagnosis, and resolution of network issues, protecting service quality and customer trust. Learn more at alvalinks.com or follow us on LinkedIn.
References:
Dave, J. "How AI is transforming network incident response and where it still falls short." Network World, May 2026.
Huang, P., et al. "Gray Failure: The Achilles' Heel of Cloud-Scale Systems." Microsoft Research, HotOS 2017.